Quality Criteria for Structures: Experimental Parameters
What are the quality criteria to look for?
When working with protein structures, it is essential to judge their quality. This applies to experimental and "calculated" structures predicted, e.g., by the AlfaFold project. An experimental protein structure is a result of an experiment. It can be verified against the specific criteria of that experiment. Still, it needs to satisfy more general criteria (which are also applied to predicted structures), like having good model geometry that includes bond angles, bond distances, and a Ramachandran plot with a low number of outliers. In addition, we require low model energy parameters. At PDB, PDBsum, and PDBe (PDB Europe), all data required for assessing model quality can be found. We will look at those in this chapter.
As mentioned in the introduction, the main experimental methods for macromolecular structure determination are X-ray crystallography, NMR spectroscopy, small-angle X-ray scattering, and Cryo-electron microscopy. Each of these methods has its quality criteria. Here we primarily focus on the quality criteria for X-ray structures. Most of the structures in the PDB come from crystallography, and in this case, the most critical experimental factors that determine structure quality include:
In the following, we will look at each of these determinants.
When working with protein structures, it is essential to judge their quality. This applies to experimental and "calculated" structures predicted, e.g., by the AlfaFold project. An experimental protein structure is a result of an experiment. It can be verified against the specific criteria of that experiment. Still, it needs to satisfy more general criteria (which are also applied to predicted structures), like having good model geometry that includes bond angles, bond distances, and a Ramachandran plot with a low number of outliers. In addition, we require low model energy parameters. At PDB, PDBsum, and PDBe (PDB Europe), all data required for assessing model quality can be found. We will look at those in this chapter.
As mentioned in the introduction, the main experimental methods for macromolecular structure determination are X-ray crystallography, NMR spectroscopy, small-angle X-ray scattering, and Cryo-electron microscopy. Each of these methods has its quality criteria. Here we primarily focus on the quality criteria for X-ray structures. Most of the structures in the PDB come from crystallography, and in this case, the most critical experimental factors that determine structure quality include:
- Quality of the X-ray data
- Resolution of the X-ray data
- Refinement (the R-factor & Rfree)
- The B-factors (temperature factors)
- Model geometry (bond distances, bond angles, Ramachandran plot)
In the following, we will look at each of these determinants.
Resolution and quality of the X-ray data
Talking about X-ray data quality requires some basic understanding of the theory of X-ray crystallography. Assuming that the X-ray data collection is made on an excellent professional level, data quality depends on the crystals used for data collection. Some crystals may give good quality data, and some may diffract poorly. If we discover that the diffraction is poor (low resolution, diffraction spots are a bit fuzzy, presence of twinning, ice rings, etc.), we can try to improve the crystal quality. In some cases, this may work, but sometimes improving the crystal quality may be challenging. Without going further into these details, we can assume that the data have been verified by the PDB staff and are of good quality, and move to the next point in our list, the resolution.
Generally, the resolution is the primary factor determining protein structure quality. High resolution guarantees better structure. The resolution for a given crystal (a specific crystal lattice and type of symmetry) is roughly determined by the number of diffraction spots (intensities) collected during a crystallography experiment. Each spot contains a bit of information, and the higher the number of spots we collect, the more detailed information we get to describe the structure. The intensities of the spots are used to calculate an electron density map into which the molecule's three-dimensional structure is built.
The diffraction images below may be used to illustrate the idea of resolution:
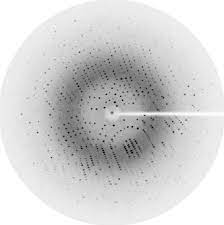
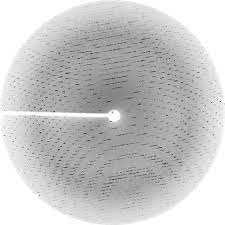
In the left image, the resolution is probably around 2.8 Å. On the other hand, the right image seems to have a substantially higher resolution and will probably give us a better structural model.
What is a good resolution?
Below are some approximate ranges of resolution to be able to put the numbers on some relative scale:
Low resolution - can be in the range from extremely low to low, up to 5 Å. Here, the overall shape of the molecule is distinguishable; at around 5 Å, we can see helices as long rods, but no detailed model building is possible.
Medium resolution (3.5-2.5 Å) - here, we start to distinguish side chains, and we can build the model. When the resolution is better than 2.8 Å, we start to see some water density and can build some water molecules into the density.
Atomic resolution (2.4 Å and better) - the model building process starts to be a pleasure; solvent molecules can be easily identified.
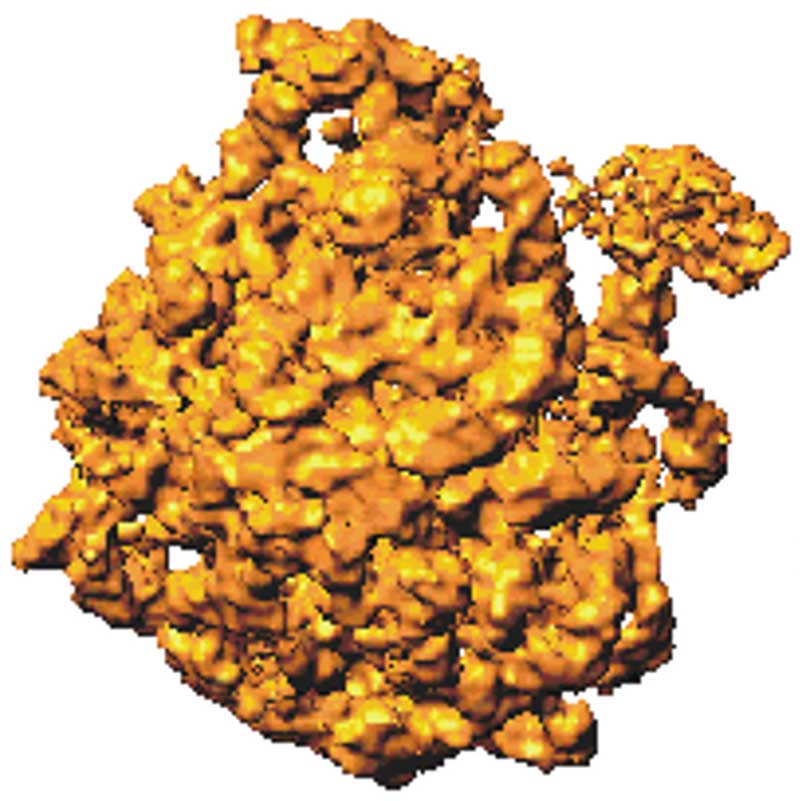
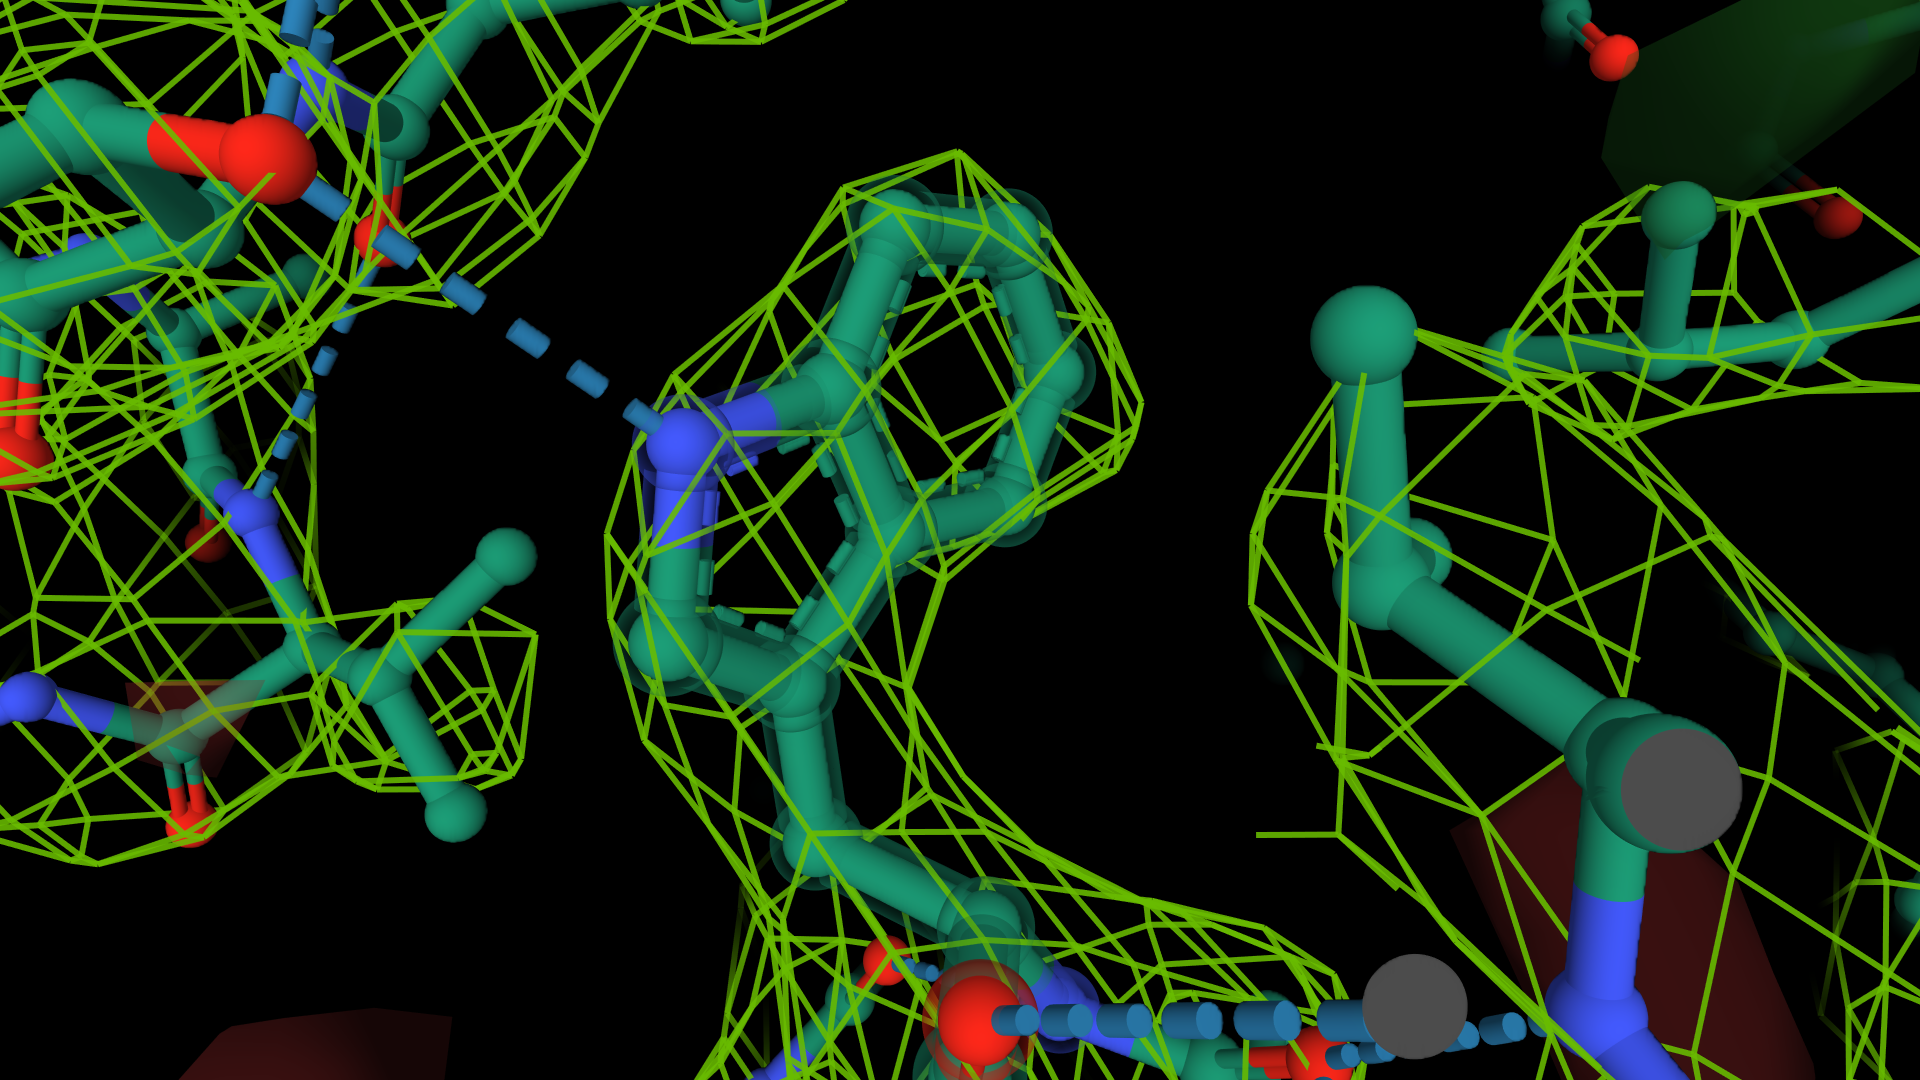
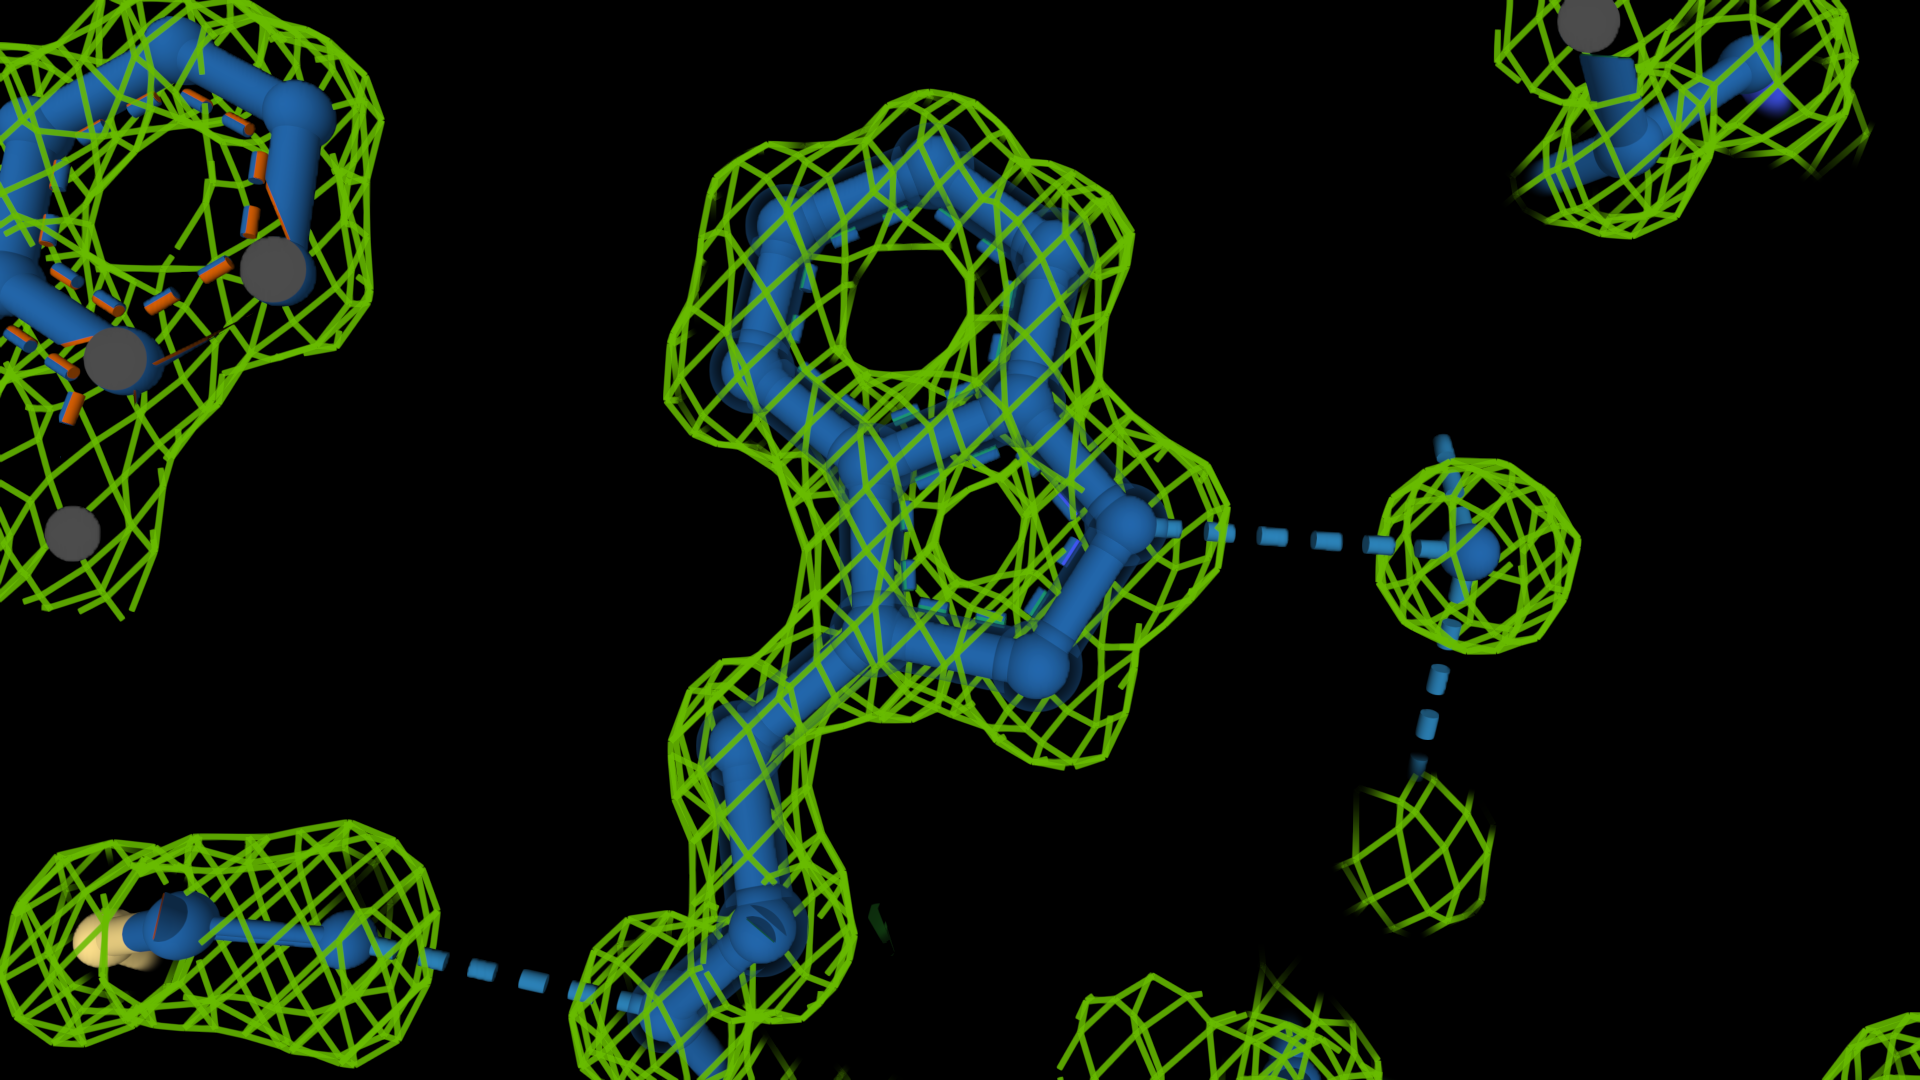
The electron density shown in the images below demonstrates the idea. The first image on the left shows an old cryo-EM reconstruction of the ribosome at 7.5 Å resolution (Matadeen et al. (1999), Structure 7, 1575-1583). In the image in the middle, the side chain of a tryptophan residue is built into a 3 Å resolution density map (Donkey hemoglobin, PDB ID 1SOH). In the last image on the right, the tryptophan side chain is built into a map with a substantially higher resolution, 1.15 Å (alcohol dehydrogenase, PDB ID 1HET). The density map is shown as a mesh, while the structure is in a ball-and-stick representation. The density on the right delineates the side chain's shape. It indicates the positions of the atoms more accurately, which will result in a more accurate and often better-quality model. In the middle image, these details are absent; we can only see the overall shape of the side chain and no positions for individual atoms. On the ribosome image, we can try to distinguish some RNA helices but that is all. We cannot see individual proteins and no secondary structure elements.
A more accurate model is essential, for example, if we are interested in protein-ligand interactions - more accurate positions of the atoms mean more accurate distances between protein and ligand atoms. This helps enormously, e.g., when using computational chemistry methods.
What is a good resolution?
Below are some approximate ranges of resolution to be able to put the numbers on some relative scale:
Low resolution - can be in the range from extremely low to low, up to 5 Å. Here, the overall shape of the molecule is distinguishable; at around 5 Å, we can see helices as long rods, but no detailed model building is possible.
Medium resolution (3.5-2.5 Å) - here, we start to distinguish side chains, and we can build the model. When the resolution is better than 2.8 Å, we start to see some water density and can build some water molecules into the density.
Atomic resolution (2.4 Å and better) - the model building process starts to be a pleasure; solvent molecules can be easily identified.
The electron density shown in the images below demonstrates the idea. The first image on the left shows an old cryo-EM reconstruction of the ribosome at 7.5 Å resolution (Matadeen et al. (1999), Structure 7, 1575-1583). In the image in the middle, the side chain of a tryptophan residue is built into a 3 Å resolution density map (Donkey hemoglobin, PDB ID 1SOH). In the last image on the right, the tryptophan side chain is built into a map with a substantially higher resolution, 1.15 Å (alcohol dehydrogenase, PDB ID 1HET). The density map is shown as a mesh, while the structure is in a ball-and-stick representation. The density on the right delineates the side chain's shape. It indicates the positions of the atoms more accurately, which will result in a more accurate and often better-quality model. In the middle image, these details are absent; we can only see the overall shape of the side chain and no positions for individual atoms. On the ribosome image, we can try to distinguish some RNA helices but that is all. We cannot see individual proteins and no secondary structure elements.
A more accurate model is essential, for example, if we are interested in protein-ligand interactions - more accurate positions of the atoms mean more accurate distances between protein and ligand atoms. This helps enormously, e.g., when using computational chemistry methods.
Refinement and the R-factor
Refinement is an essential step in protein structure determination. During refinement, the structural model, which was built into the initial electron density map, is adjusted to fit the experimental density as accurately as possible. The R-factor is then used to assess how well the model fits the experimental data. Below is the equation used to calculate the R-factor:

In the equation, Fobs and Fcalc represent observed and calculated structure factors. Fobs are derived from the measured diffraction intensities, while Fcalc is calculated from the model structure built into the electron density. The lower the R-factor, the better the model. For protein crystals, the R-factor for refined structures is typically 25% to 14%, while for small molecule structures, it is typically around 4%.
Ideally, the values should be the same for proteins and small molecules, but this is never the case. The 4% for small molecules reflects the experimental errors, which are impossible to avoid, no matter how accurate we try to be during X-ray data collection. For proteins, in addition to the experimental errors, there are a few other factors that lead to higher R values. One of them is crystal disorder, the imperfect packing of the molecules within the crystal lattice. This results from the high solvent content in protein crystals - usually, it is between 40% to 50%. Still, sometimes it can be considerably higher, leading to poor quality of crystal diffraction and poor agreement of Fobs to Fcalc (high R-factor values). An additional factor is the internal flexibility of protein molecules. The flexibility can be on a side chain level, an entire loop, and even include a whole domain within a multi-domain protein. Loops and side chains on the surface of proteins are often very flexible and poorly resolved in electron density maps. We say they have high temperature factors, usually called the B-factor (see below). When analyzing a protein structure, we want the R-factor to be as low as possible. Models with R-values outside the range described above should be considered with suspicion and scrutinized to clarify the reasons for the high R-factor value.
When calculating the R-factor, there is always a danger of so-called "model overfitting." This has to do with the nature of the mathematical procedure used in the calculation and is not discussed here. The result of model fitting is an artificially lower R-factor. To avoid this, the idea of R-free was introduced. R-free is calculated of a subset of Fobs (5% to 10%), which is excluded during the refinement. This provides a more objective estimate of the R-factor. PDB entries and coordinate files usually provide R and R-free values for a structure. Generally, R is about 2% R-free lower than R-free.
The temperature factor (B-factor) definition and role
The temperature factor, also called the B-factor, is calculated during the refinement of the structure. The temperature factor for an atom is defined through its mean displacement from an average position:
B=8π2x2, where x is the mean displacement of the atom.
For proteins, the normal range of B is around 12 Å2 to 20 Å2, which corresponds to displacements in the range of 0.15 Å to 0.5 Å. However, higher B values, like 60 Å2 to 70 Å2, are not unusual. For low resolution structures, these values are usually higher.
Almost all graphic programs for displaying protein structures have the option of coloring the structure according to temperature factors. The regions of high flexibility (high B-factors) are then shown in red, while the low B-factor regions are colored in blue. This feature is useful when assessing the quality of different parts of the structure. Usually, high-B regions are more flexible and, as a result, have weak electron density. Model building in such regions may be challenging and result in a low-quality model for that region. In the PDB file, each atom's B-factor is the last number in the respective row.
The parameters described here are associated with the X-ray experiment and are unique for crystallographic structures.
Quality Criteria for Geometry
The more general quality criteria (also applied to predicted/modeled structures) include good model geometry like bond angles and bond distances and a Ramachandran plot with a low number of outliers.
In the case of bond distances and bond angles, average values are calculated from the structure and compared to the corresponding values obtained from small molecule structures. As noted above, small molecule structures have very low R-factors, which suggests that coordinate errors are comparable to actual experimental errors. This means that in contrast to proteins, the positions of the atoms are determined with substantially higher accuracy. Bond distance and angles calculated from these structures are assumed to be close to "ideal values." The deviation of these values from ideal values in proteins is given in the header of the PDB coordinate file. I should say that modern refinement software usually does not allow large deviations from ideal values. Therefore, most modern protein structures do not show significant deviations from ideality in bond distance and angles.
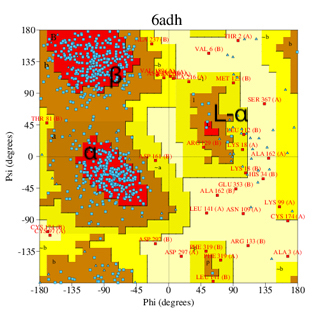
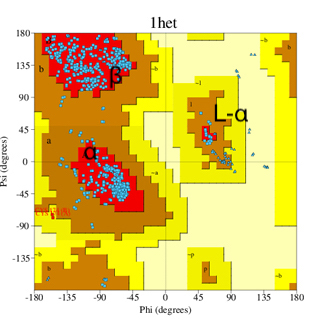
A good quality Ramachandran plot is one of the most important attributes of a good experimental or structural model. We discussed the plot earlier; for clarity, I show the same pair of plots, a well-refined structure, and a low-resolution, poorly refined structure (images below). The image on the left (PDB code 6adh) corresponds to a structure at around 2.9 Å resolution, while on the right, the structure (1het) is at 1.15 Å resolution (much higher resolution).
In the case of bond distances and bond angles, average values are calculated from the structure and compared to the corresponding values obtained from small molecule structures. As noted above, small molecule structures have very low R-factors, which suggests that coordinate errors are comparable to actual experimental errors. This means that in contrast to proteins, the positions of the atoms are determined with substantially higher accuracy. Bond distance and angles calculated from these structures are assumed to be close to "ideal values." The deviation of these values from ideal values in proteins is given in the header of the PDB coordinate file. I should say that modern refinement software usually does not allow large deviations from ideal values. Therefore, most modern protein structures do not show significant deviations from ideality in bond distance and angles.
A good quality Ramachandran plot is one of the most important attributes of a good experimental or structural model. We discussed the plot earlier; for clarity, I show the same pair of plots, a well-refined structure, and a low-resolution, poorly refined structure (images below). The image on the left (PDB code 6adh) corresponds to a structure at around 2.9 Å resolution, while on the right, the structure (1het) is at 1.15 Å resolution (much higher resolution).
Click to view a larger version!
Click to view a larger version!
Concluding remarks
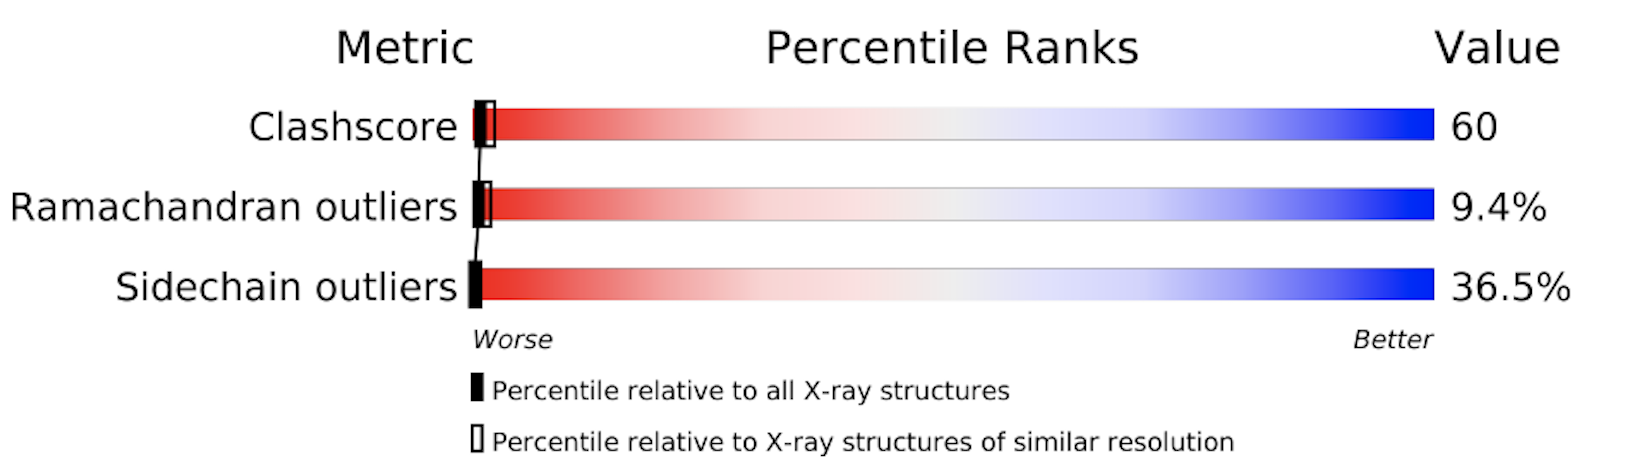
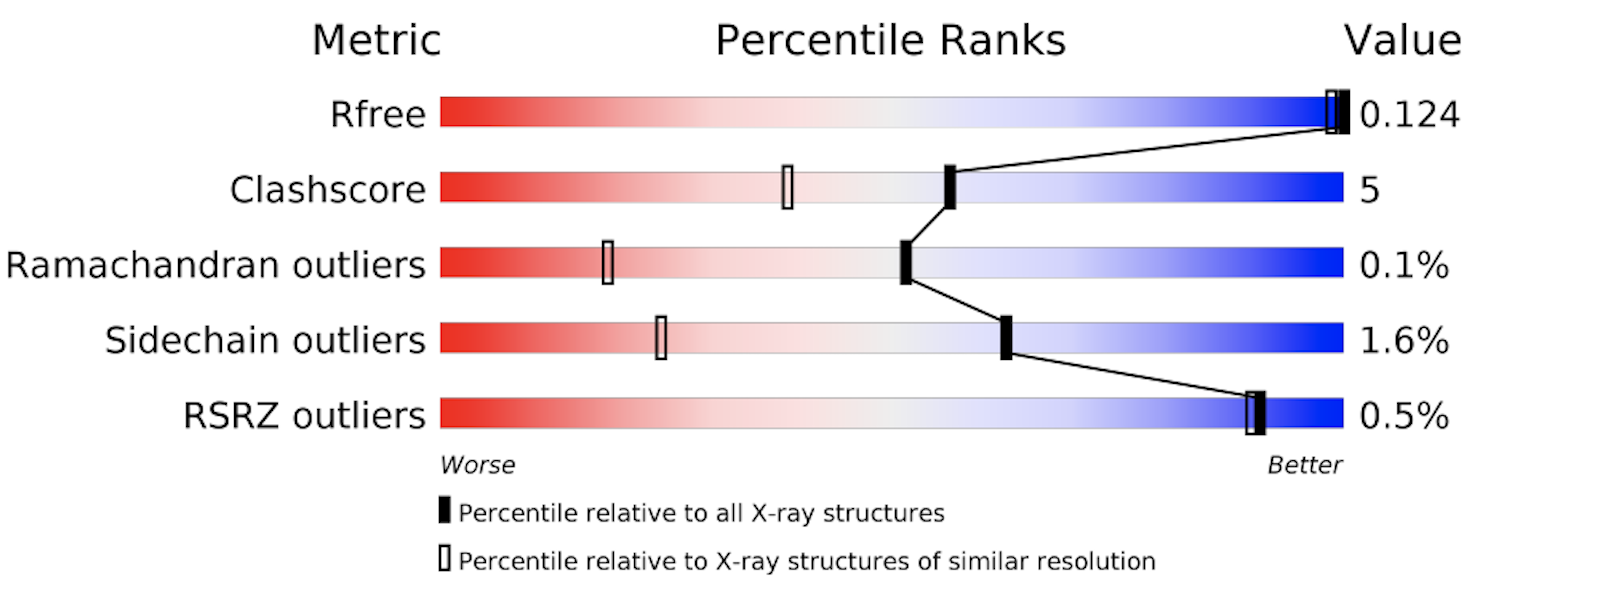
The PDB provides a detailed evaluation report on each structure. A short graphical summary is always provided on that structure's main page. The images below show the graphical summary for 6ADH and 1HET, the Ramachandran plots of which are shown above. You may notice that 6ADH has a high clash score (atoms too close to each other), 9.4% Ramachandran outliers, and 36.5% side chain outliers. 1HET shows much better numbers, with only 0.1% Ramachandran outliers, a clash score of 5, etc. In addition, Rfree is excellent for a protein structure (12,4%).
The PDB provides a detailed evaluation report on each structure. A short graphical summary is always provided on that structure's main page. The images below show the graphical summary for 6ADH and 1HET, the Ramachandran plots of which are shown above. You may notice that 6ADH has a high clash score (atoms too close to each other), 9.4% Ramachandran outliers, and 36.5% side chain outliers. 1HET shows much better numbers, with only 0.1% Ramachandran outliers, a clash score of 5, etc. In addition, Rfree is excellent for a protein structure (12,4%).