Validation and Quality Assessment of Protein Structures
We explain the validation criteria for protein X-ray crystallographic structures used in assessing quality. The primary experimental parameters to verify include the resolution of the X-ray data, the R-factor, and model geometry.
The Validation & Assessment Criteria
As mentioned earlier, structures in databases can be experimental or predicted. In both cases, one parameter we need to focus on is the quality of the structure. In this section, we will discuss the quality criteria for X-ray crystallographic structures.
Searching the PDB for an experimental structure with the name of a protein may return several entries. Some of these may be complexes with various ligands, while others could be different versions of the protein featuring amino acid replacements or other modifications. If we require the structure, e.g., for analyzing important interactions to design a new inhibitor, examining certain regions for mutation planning, comparing it to another structure, or studying sequence-structure relationships, we clearly want to use the best available structure. In other words, when dealing with protein structures, it is crucial to have quality criteria.
An experimental protein structure results from an experiment and usually validated against that experiment. However, it must also meet broader range of criteria, which are also applicable to predicted structures. Among these parameters is having good model geometry that includes bond angles, bond distances, and a Ramachandran plot with a low number of outliers. Additionally, we expect adequate model energy parameters. The protein databases PDB, PDBsum, and PDBe (PDB Europe) provide all the data necessary for evaluating model quality. Now we need to learn how to analyze these parameters.
Validating an Experimental Structure
As mentioned in the introduction, the primary experimental methods for macromolecular structure determination are X-ray crystallography, NMR spectroscopy, small-angle X-ray scattering, and Cryo-electron microscopy. Each method has its own quality criteria. Since most of the structures in the PDB come from X-ray crystallography, we primarily focus on this method here. The essential criteria used in validation and assessment are:
- Quality of the X-ray data
- Resolution of the X-ray data
- Refinement (the R-factor & Rfree)
- The B-factors (temperature factors)
- Model geometry (bond distances, bond angles, the Ramachandran plot)
Resolution and Quality of the X-ray Data: Higher Resolution Yields Better Structure!
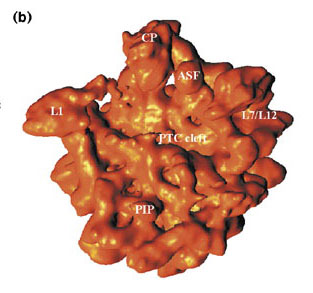
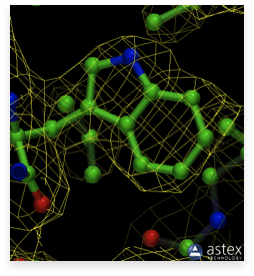
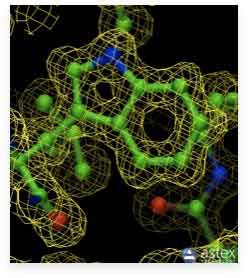
As noted in the previous section, resolution is one of the most important parameters for a structure obtained through protein crystallography. A higher resolution yields a better structure, with the positions of the atoms defined with greater accuracy. This can be observed in the images below. The first image on the left displays an old cryo-EM reconstruction of the ribosome at a resolution of 7.5 Å (Matadeen et al., 1999, Structure 7, 1575-1583). The middle image shows the side chain of a tryptophan residue incorporated into a 3 Å resolution electron density map (Donkey hemoglobin, PDB ID 1SOH). In the last image on the right, the tryptophan side chain is built into a map with a substantially higher resolution of 1.15 Å (alcohol dehydrogenase, PDB ID 1HET). The density map is represented as a mesh, while the structure is in a ball-and-stick representation. The high resolution density on the right clearly indicates the positions of the atoms. However, for the density in the middle, it would be impossible to place the atoms accurately. In the ribosome image, we could distinguish some RNA helices, but not much more. We cannot even see individual proteins or any secondary structure elements. This illustrates the importance of resolution.
The R-factor
Refinement is an essential step in protein structure determination. As mentioned in the previous section, during refinement, the structural model, which was built into the initial electron density map, is adjusted to fit the calculated density as accurately as possible. The R-factor is then used to assess how well the model fits the experimental data.
For protein structures, the R-factor typically ranges from 25% to 14%, while for small molecule structures, it is usually around 4%. Ideally, these values should be the same for protein and small-molecule X-ray structures, but this is never the case. The 4% for small molecules reflects experimental errors that are impossible to avoid, regardless of how accurate we are during X-ray data collection, data reduction, etc. For proteins, in addition to the experimental errors, several other factors contribute to higher R values. One factor is crystal disorder, the imperfect packing of molecules within the crystal lattice. This often results from the high solvent content in protein crystals, which usually ranges between 40% and 50%. Occasionally, it can be even higher, leading to poor crystal diffraction quality and a poor agreement of Fobs to Fcalc (high R-factors). Another factor is the internal flexibility of protein molecules. This flexibility can occur at the side chain level, at the level of an entire loop, or even involve a whole domain in a multi-domain protein. Loops and side chains on the surface of proteins are often very flexible and are poorly resolved in electron density maps. We say they have high temperature factors, known as B-factors (see below). While disordered regions contribute to the scattering of X-rays (Fobs), they are often impossible to account for in the model. This leads to the apparent discrepancy between Fcalc and Fobs and, ultimately, higher R-factor values.
When analyzing a protein structure, we want the R-factor to be as low as possible. Models with R-values outside the previously mentioned range should be viewed with suspicion and scrutinized to clarify the reasons for the elevated R-factor value.
The Temperature Factor (B-factor) Definition and Role
The temperature factor, also called the B-factor, is calculated during the refinement of the structure. The temperature factor for an atom is defined through its mean displacement from an average position:
B=8π2×2, where x is the mean displacement of the atom.
For proteins, the normal range of B is about 12 Ų to 20 Ų, which corresponds to displacements between 0.15 Å and 0.5 Å. However, higher B values, such as 60 Ų to 70 Ų, and even higher, are not unusual. These average B-factors are typically greater for low-resolution structures. In the PDB file, each atom’s B-factor is the last number in the row, and nearly all graphics programs for displaying protein structures offer the option to color the structure based on temperature factors. Regions of high flexibility (high B-factors) are usually indicated in red, while low B-factor regions are displayed in blue. This feature is valuable for assessing the quality of different parts of the structure. Generally, high-B regions are more flexible and exhibit weaker electron density. This is clarified by the definition of the term “electron density,” which roughly refers to the number of electrons per unit of volume. We encounter low electron density when the volume is large (due to flexibility). If the density becomes too low, it may approach the noise level, making model building challenging or even impossible.
Quality Criteria for Model Geometry
One of the general quality criteria, applicable to both predicted and modeled structures, pertains to model geometry. The assessed parameters include bond lengths, bond angles, and torsion angles, which are visualized in the Ramachandran plot.
For validation purposes, average values of bond lengths and bond angles are calculated from the structure and compared to the corresponding values obtained from small-molecule structures. Small-molecule structures are typically determined at high resolution and refined to low R-factors. Consequently, bond lengths and bond angles acquired from these structures are deemed to be much more accurate than the respective values derived from protein structures and are assumed to be close to some “ideal values.” The average deviation of bond lengths and bond angles from ideality in proteins is noted in the header of the PDB coordinate file, although modern refinement software applies restraints to these parameters and does not permit large deviations. Therefore, most contemporary protein structures do not exhibit significant deviations from ideality in bond lengths and angles.
A good quality Ramachandran plot is one of the most essential attributes of a good experimental model. We discussed the Ramachandran plot earlier; for clarity, I present the same pair of images here. On the right, the structure is well-refined at high resolution (1.15 Å), and on the left is a low-resolution (2.9 Å) structure that is poorly refined (images below). We can see that the dots representing Phi and Psi angles are significantly better clustered in the high-resolution structure (with 99,6% of the dots in the most favorable and additionally allowed regions) compared to the low-resolution structure, which has only 68% of the dots in the most favorable region and 26.8% in the additional allowed regions, while 2.5% of the angles are found in the disallowed regions. If I had to choose a structure for my project, I would have no doubts about which of these two to select.


Concluding Remarks
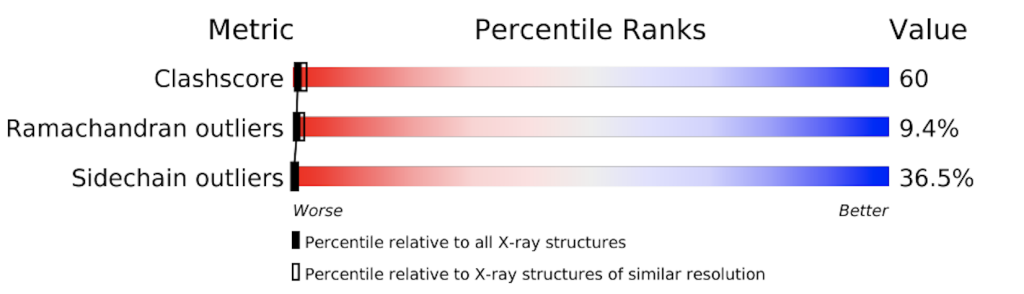
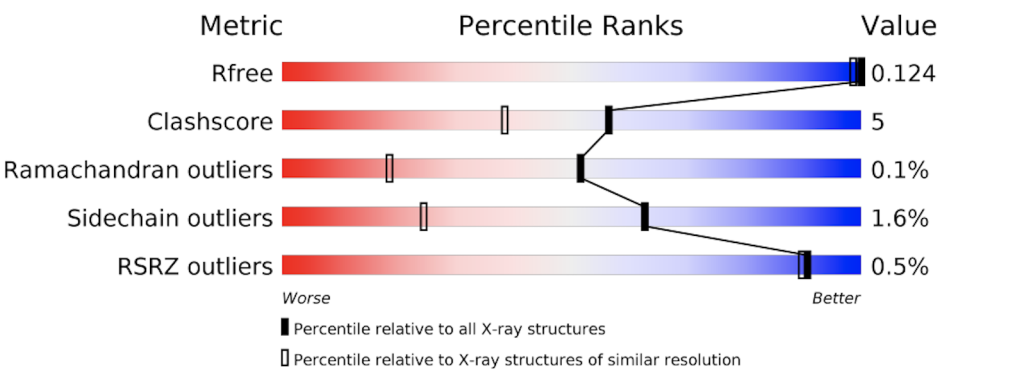
The PDB provides a detailed evaluation report on each structure. A short graphical summary is always provided on that structure’s main page. The images below show the graphical summary for 6ADH and 1HET, the Ramachandran plots of which are shown above. You may notice that 6ADH has a high clash score (atoms too close to each other), 9.4% Ramachandran outliers, and 36.5% side chain outliers. 1HET shows much better numbers, with only 0.1% Ramachandran outliers, a clash score of 5, etc. In addition, Rfree is excellent for a protein structure (12,4%).