Ramachandran Plot and Phi, Psi Torsion Angles
Definition
There are two primary torsion (rotation) angles in the polypeptide chain, also known as Ramachandran angles (after the Indian physicist who worked on modeling the interactions in polypeptide chains, Ramachandran, G N et al. (1963), J Mol Biol, 7:95-99). These angles (Ramachandran angles) describe the rotations of the polypeptide backbone around the bonds between N-Cα (called Phi, φ) and Cα-C (called Psi, ψ) and essentially determine the fold of the protein. An image on the right explains the concept.
By using three consecutive bonds involving four atoms to define the torsion angle (dihedral angle), we can describe the rotation of the polypeptide chain around the middle bond. The image below demonstrates this.
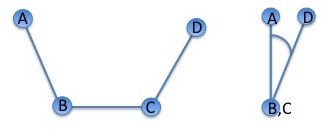
Illustration of the standard IUPAC definition of a dihedral (torsion) angle: A, B, C, and D illustrate the positions of the four atoms used to define the dihedral angle. The rotation takes place around the central B-C bond. On the right, the atoms are viewed along the B-C bond, with atom A placed at 12 o’clock. The rotation around the B-C bond can be described by the A-B-D angle shown on the right. Positive angles correspond to clockwise rotation.
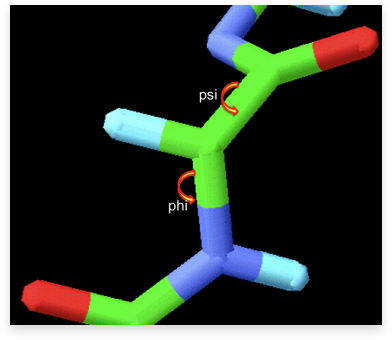
A section of a polypeptide chain illustrating the rotation around the bonds that define the protein’s Phi & Psi (φ and ψ) torsion angles. φ and ψ angles are depicted with rounded arrows. In green are carbon atoms (the central atom in the image is Cα).
The Ramachandran Plot
A special method for plotting and visualizing protein torsion angles was introduced by Ramachandran and co-authors and has since been referred to as the Ramachandran plot. In the Ramachandran plot, we can observe the distribution of torsion angles in a protein structure. The horizontal axis of the plot displays φ values, while the vertical axis shows ψ values. Both the horizontal and vertical axes start from -180 and extend to +180 (images below). Each dot in the plot represents an amino acid, with its φ and ψ angles serving as coordinates on the plot. In the images, the regions corresponding to the φ and ψ angles of α-helices (red regions, lower cluster) and β-sheets (red regions, upper cluster) are clearly separated. These regions are referred to as the energetically most favored regions. In these conformations of the polypeptide chain, the interaction energy between the atoms of the torsion angle is at its most optimal. The other colors (ranging from brown to pale yellow) indicate that the energy progressively becomes less favorable (higher). We can also observe a difference in the distribution of the torsion angles between the two images. The dots are significantly better clustered in the high resolution structure (with 99,6% of the dots in the most favorable and additionally allowed regions, see figure legend) compared to the low resolution structure, which has only 68% of the dots in the most favorable region and 26.8% in the additional allowed regions. Notably, 2.5% of the angles are distributed in the disallowed regions. What accounts for this difference? It is, of course, the resolution, which almost automatically guarantees a better quality of the structures. This is discussed further in the section on structure validation and assessment.
Theoretically, the average phi and psi values for α-helices and β-sheets were predicted to cluster around -57, -47, and -80, +150, respectively. However, experimental structures revealed different values. For those interested in a detailed analysis of the distribution of torsion angles of experimental structures, I recommend the paper by Hovmöller et al., 2002, which provides an excellent discussion of the subject.


A Ramachandran plot showing the distribution of the torsion angles of a protein refined at two different resolutions.
The image on the left (PDB code 6adh) corresponds to a structure at approximately 2.9 Å resolution, while on the right, the structure (1het) is at 1.15 Å resolution (a significantly higher resolution). The dots for the high-resolution structure (1het) are well clustered within the energetically most favorable (red, 90.4%) and additionally allowed (brown,9.2%) regions of secondary structure (α-helices, β-sheets, and left-handed α-helix L-α). Conversely, at the lower resolution, many dots are located in energetically less favorable regions (yellow, generously allowed with 2.7% and disallowed with 2.5%). This difference is attributed to the higher quality of the high-resolution structure (see text below). The horizontal axis on the plot represents φ values, while the vertical axis represents ψ values. Both axes range from -180 to +180.
Images generated at PDBsum.
The Ramachandran Plot and Structure Quality
Generally, the higher the resolution of the X-ray data, the higher the quality of the three-dimensional structure. This is reflected, as mentioned above, in the better clustering of the Phi and Psi angles in the Ramachandran plot in the secondary structure regions. This indicates that the Ramachandran plot can be used as one of the critical indicators in quality assessment of a three-dimensional structure. A good high-resolution and well-refined structure is expected to have the majority, if not all, of its torsion angles within the allowed regions of the plot (right image above). However, sometimes, we may find amino acids with “wrong” torsion angles, which may be for a good reason. The strain (high energy) created in a structure by such conformations may have functional significance (Pal & Chakrabarti, 2002) and may even be conserved within a protein family!
Another exception to the principle of clustering around the α- and β-regions is provided by glycine. Glycine residues lack a side chain, which allows for greater flexibility in regions of the polypeptide chain where Gly is found (typically surface loops, which explains the relatively high exposure of Gly in protein structures). Consequently, these regions may adopt conformations that would otherwise be forbidden. As mentioned earlier, proline, unlike glycine, fixes the torsion angles at a specific value, very close to that of an extended β-strand. A result of the significance of glycine and proline residues in protein structures is their high conservation in protein sequences, which can be easily revealed through a sequence alignment.